
August 10, 2026
We Analyzed 4.5 Million FMCSA Carrier Registrations — 53% of Active Trucking Companies Own One Truck
We pulled the complete US DOT carrier census — 4,470,671 registrations — with our FMCSA DOT crawler and counted what is actually out there: how many carriers are real, how big they are, and how long they last.
Key numbers:
| Metric | Value |
|---|---|
| DOT registrations on file | 4,470,671 |
| Carriers with an active registration | 2,224,835 |
| Active carriers operating exactly one truck | 53.0% |
| Active carriers operating five trucks or fewer | 80.3% |
| Active carriers authorized for interstate work | 31.3% |
| Active carriers with no safety rating on record | 97.6% |
How we counted
Every figure here comes from the public FMCSA carrier census published by the US Department of Transportation, pulled in July 2026 through the FMCSA DOT crawler and analyzed in full — 4,470,671 registration records, not a sample.
Two counting decisions drive everything below, and both are easy to get wrong.
A DOT number is not a company. DOT numbers are issued and never retired, so the registry accumulates. The 4.47M figure that gets quoted as "trucking companies in America" counts every registration ever issued, including decades of dead ones. The number that means something is the 2,224,835 carriers whose registration is currently active — under half the file. Every percentage in this article uses that denominator.
Self-reported fleet size has a garbage tail. Power-unit counts come from the carrier's own MCS-150 filing, and nobody validates the field. Summing it across active carriers returns 85 million power units — implausible on its face, and the reason is visible in the data: 1,074 registrations, 0.05% of the file, account for 74.7M of that 85M. One of them is a single-driver operation declaring 4,504,505 trucks. We exclude declarations above 10,000 from every fleet calculation, which leaves 10,308,439 power units across the remaining active carriers, and we count the excluded records rather than quietly dropping them.
Registration status is a snapshot as of July 2026. Carriers that deactivate and re-register receive a new DOT number, so cohort figures track registrations, not corporate lineage.
Most trucking companies are one person and one truck
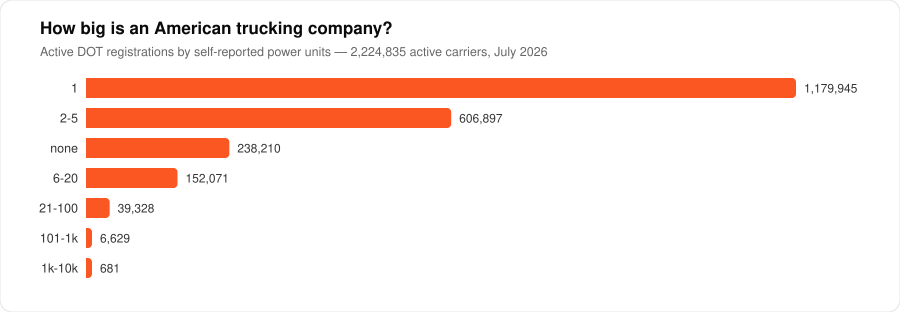
American trucking is not an industry of fleets. It is an industry of individuals who own a truck, and the registration data says so plainly. 1,179,945 active carriers — 53.0% — report exactly one power unit. Another 606,897 report two to five. Together that is 80.3% of every active carrier in the country operating five trucks or fewer.
Among carriers that report any trucks at all (10.7% report zero), the concentration is sharper still: 59.4% are single-truck operations and 89.9% run five or fewer.
The other end of the distribution is thin to the point of rarity. Only 7,310 active carriers credibly report more than 100 trucks — 0.33% of the industry — and they hold 42.0% of all credibly reported power units. Single-truck carriers, 53% of the registry by count, hold 11.4% of the trucks. The industry has a handful of large fleets and a very long tail of individuals, with remarkably little in between: just 681 carriers sit in the 1,001-to-10,000 range.
Only a third of carriers hold interstate authority
Interstate trucking dominates the public image of the industry and is a minority of it. Of active carriers, 696,458 (31.3%) hold interstate authority. The larger group — 1,397,101, or 62.8% — is registered for intrastate non-hazmat work only, with a further 47,008 intrastate hazmat.
This matters for anyone sizing the market from registration counts. A question like "how many trucking companies could haul my freight across the country" has an answer closer to 700,000 than to 4.5 million, and the gap between those two numbers is the difference between a registry and a market.
Registrations also cover more than carriers: 102,247 active brokers, 35,331 carrier-shippers, and 8,703 freight forwarders sit in the same file.
The 2021 boom, and the bust that followed it
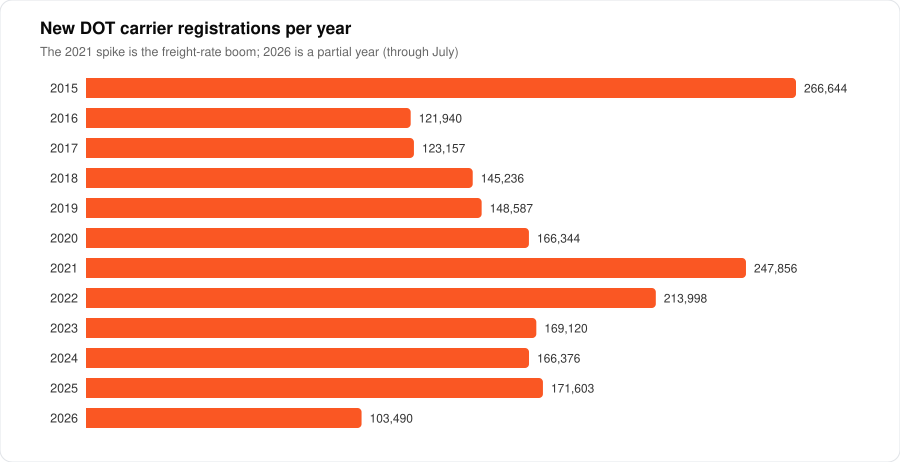
New registrations track the freight cycle with almost no lag. Entries climbed from 166,344 in 2020 to 247,856 in 2021 — a 49% jump, coinciding with the spot-rate spike that made running your own authority look attractive. The correction was just as sharp: 213,998 in 2022, then 169,120 in 2023, a 32% fall from the peak. 2024 and 2025 have flattened at roughly 166,000 and 171,600.
The more interesting question is what happened to the people who entered at the top.
Entering during the boom was worse than entering before it
Because the file records both the registration date and current status, the survival of each entry cohort is directly measurable. Attrition is heavily front-loaded: 90.0% of 2025's entrants are still active, 75.7% of 2024's, 63.1% of 2023's, 52.7% of 2022's, and 49.2% of 2021's. Roughly half of new carriers are gone within five years.
The 2021 cohort is the anomaly worth noting. It survives worse than cohorts registered in 2019 (58.6%) and 2020 (55.7%), despite being one and two years younger. Carriers that got their authority at the top of the market washed out faster than the ones who were already there when it arrived — consistent with entrants who priced a business on peak spot rates and met the 2022–23 rate collapse before they had built any cushion.
One caveat on the time series: 2015 shows both an outsized entry count (266,644) and a 74.4% survival rate that no neighbouring year comes close to. A cohort eleven years old does not outlast one five years old, so this is far more likely a registration-record artifact than a real signal. We exclude 2015 from cohort comparisons rather than offer a cause we cannot evidence.
Fleet size is the strongest survival signal in the data
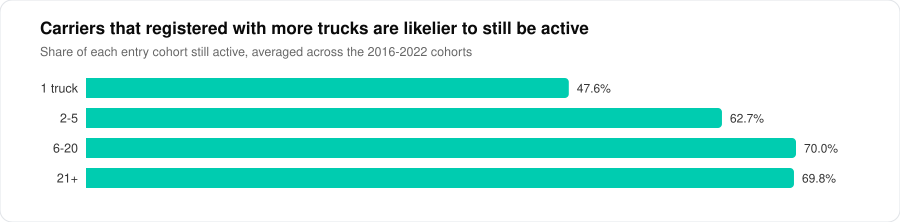
Splitting each cohort by the fleet size it registered with produces the most consistent finding in the dataset. For every cohort at least four years old, a single-truck carrier is roughly 17 to 30 percentage points less likely to still be active than a carrier that registered with 6 to 20 trucks.
The 2018 cohort, eight years on: 41.2% of single-truck entrants are still active, against 58.2% at two-to-five trucks, 67.0% at six-to-twenty, and 70.4% at twenty-one plus. The 2021 cohort, five years on, shows the same ordering with a wider gap — 42.1% against 72.0%.
The ordering — bigger first filing, better survival — holds in all ten cohorts measured, which is what makes it worth something; the 17-to-30-point figure covers the seven that are at least four years old. This is an association, not a mechanism: fleet size at registration also proxies for capital, existing customers, and industry experience, and we cannot separate those with registration data alone. But if you are underwriting new authority, the size of the first filing carries real signal.
97.6% of active carriers have no safety rating
Of 2,224,835 active carriers, 2,171,168 carry no safety rating at all. Just 41,564 are rated Satisfactory, 11,328 Conditional, and 775 Unsatisfactory.
Safety ratings follow a compliance review, and compliance reviews reach a small fraction of a two-million-carrier registry. The practical consequence for anyone screening carriers: absence of a rating is the norm, not a warning, and a screen that treats "unrated" as a risk flag is flagging 97.6% of the industry. The 775 Unsatisfactory ratings are the genuinely rare signal.
Where the carriers are
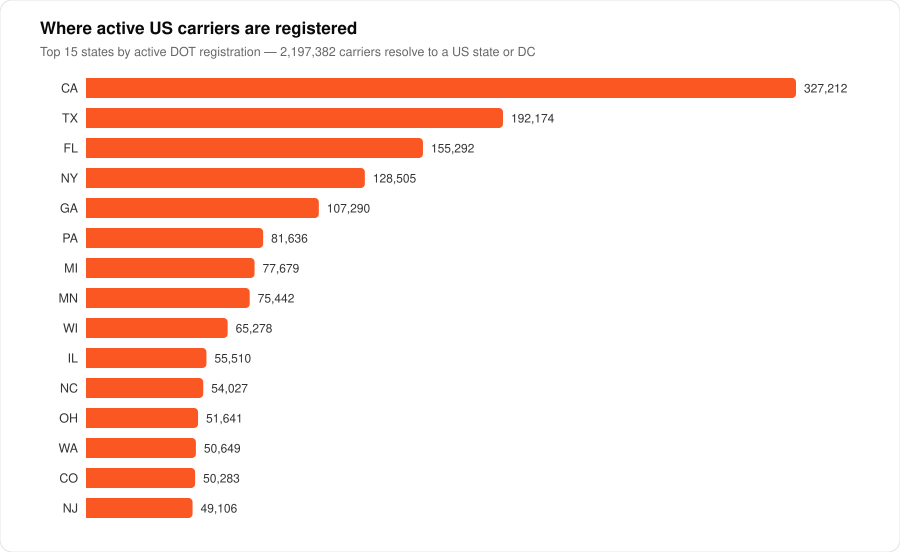
California registers the most active carriers at 327,212, followed by Texas (192,174), Florida (155,292), New York (128,505), and Georgia (107,290). Addresses resolve to a US state or DC for 2,197,382 active carriers — 98.8% of the total; the remainder are Puerto Rico, territories, and unparseable addresses.
The one-truck share varies more than the headline suggests:
| State | Active carriers | One-truck share |
|---|---|---|
| California | 327,212 | 54.4% |
| Texas | 192,174 | 57.3% |
| Florida | 155,292 | 63.5% |
| New York | 128,505 | 54.9% |
| Georgia | 107,290 | 56.8% |
| Pennsylvania | 81,636 | 47.9% |
| Michigan | 77,679 | 49.9% |
| Minnesota | 75,442 | 53.8% |
| Wisconsin | 65,278 | 54.7% |
| Illinois | 55,510 | 43.4% |
| North Carolina | 54,027 | 51.7% |
| Ohio | 51,641 | 46.1% |
| Washington | 50,649 | 54.3% |
| Colorado | 50,283 | 53.3% |
| New Jersey | 49,106 | 52.2% |
Florida's carrier base is 63.5% single-truck; Illinois is 43.4%. A twenty-point spread between two large states means "the average US carrier" is a weak abstraction — the composition of the industry genuinely differs by state, and any per-state model built on a national fleet-size average will be wrong in both directions.
Reproduce or extend this dataset
Everything above comes from public US DOT records via the FMCSA DOT crawler — filter by DOT range, fleet size, or registration date and get structured carrier records including authority status, power units, drivers, cargo classifications, inspections, and safety ratings. For the surrounding freight stack, see How to Get FMCSA Carrier Data, and for the same treatment applied to a different registry, We Analyzed 36,870 Investment Adviser Firms.
If you use these numbers, cite this page. If you want a cut we did not run — by cargo type, by metro, by mileage band — the analysis rebuilds from scratch in under an hour.